Online ecommerce stores, think of Amazon, Flipkart, Ebay, Myntra etc..all are created with one main purpose and that is to sell products online and to generate profits ($$$$) in return. The primary goals for such websites would be:
- To get as much traffic on the site as possible in order to get more orders– ($$)
- To sell as many products per hour as possible– ($$)
- To constantly increase revenue– ($$)
- To constantly increase the average profit per order– ($$)
Every goal talks about conversion in monetary terms, isn’t it?
Now, this is where most of the businesses can go wrong. Remember, revenue generation is the ultimate destination but the path taken by the customer in order to reach that destination should also be considered when measuring conversions. Macro conversions is your ultimate destination where you generate profit in monetary terms while micro conversions are those little tid-bits that users often get engaged with in order to reach the end of sale.


Cool…but a successful entrepreneur always gets the whole process started again once a sale is generated, so the end point becomes a starting point and the process goes on recursively.
Macro Vs Micro Conversions
Think of macro conversion as when a visitor purchases a product from your site worth $500. Assume, the average profit per order is $20 so for that sale your profit is $20. This can be measured in monetary terms so that’s indeed a macro conversion for an online store selling products.
Think of micro conversion as the steps taken by the visitor from the moment he finds your site to the moment he pays via payment gateway or orders via COD. A series of steps can happen in between like:
- User registers on the site
- User adds product on the cart
- User signs up for a newsletter
- User browses top product pages on your site
- User checks your promotional email etc.
All these are nothing but micro conversions because these are the steps that a normal user takes before he is convinced to purchase a product. An efficient ecommerce digital marketer knows how to measure every minute detail of the path which the users takes before they complete the sale.
Tracking Macro and Micro Conversions Via Google Analytics (Examples)
Google Analytics lets you track every activity that you think is of some importance for your business. Here, I will prepare a custom dashboard in GA in order to start tracking both macro and micro conversions.
1- After logging in to GA, I clicked on Dashboards – > New Dashboard.
2- I am naming my dashboard as “Macro and Micro Conversions” (you can name your dashboard as per your choice).
3- Now, I will add the following widgets in my dashboard:
A- Sale complete (Macro) – This will display the number of sales generated during a specified period. Click on “add a table” and choose Goal Completion Location under Dimension drop down and the associated goal from the Metric drop down.

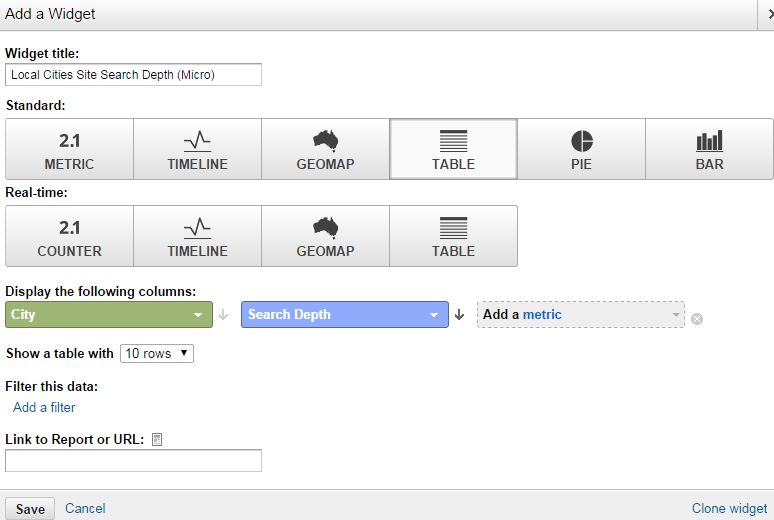
B- Local Cities Site Search Depth (Micro) – This will display city specific visits and the average number of pages viewed through that location after performing a search. Click on “add a table” and choose City under Dimension drop down and Search Depth from the Metric drop down.
C- User Registrations (Micro) – This will display the number of user registrations that happened on the site during a specified period. Click on “add a table” and choose Goal Completion Location under Dimension drop down and the associated goal from the Metric drop down.
D- Time on Page by Destination Page (Micro) – This will display the product pages where users are spending the most of their time. Click on “add a table” and choose Destination Page under Dimension drop down and the Time on Page from the Metric drop down.
E- Product Adds to Cart by Product Brand (Micro) – This will display the top product brands and their best products that are regularly added by the customers in their cart. Click on “add a table” and choose Product Brand under Dimension drop down and Product Adds to Brand from the Metric drop down.

F- Newsletter Sign Up (Micro) – This will display the number of newsletter sign ups that happened during a specified period. Click on “add a table” and choose Goal Completion Location under Dimension drop down and the associated goal from the Metric drop down.
Great! Now I suppose you got an idea as to how you can create superior custom dashboard and measure the impact of marketing on your site.
Make sure to properly segment your channels and measure their individual impact on your ROI.
Let me know about your thoughts on this tutorial.
Also See:
Difference Between Enhanced CPC and Conversion Optimizer
Also See:
Difference Between Enhanced CPC and Conversion Optimizer
