There has been a constant buzz regarding the Google Data Studio. The free version gives a chance to everyone to give it a try. Google has always presented users with advanced tools and modification to ease the functionality of e-commerce business.
Google Data Studio has been designed with the same ideology. With this tool you can integrate various ad channels on a single platform to overview the buying habits and pattern of your customers. A user can easily create a report on the dashboard with all the necessary data repotting.
You are presented with a sorted interface where in you can add and view detailed description of data in tabular or any other representative form such as pie charts. Google data Studio is a much needed tool for SEO industry that needs to present crisp and to the point data reporting. It helps to present everything in a clean manner and lets professionals stay in sync with the SEO professionalism and lingo.
How does it work?
You can easily get started by logging in with your existing Google account which you use for your Analytics and AdWords accounts.
Here is a step by step guide of how you can work on Google Data Studio with ease:
- Sync Resources
- Once you have logged in with your Google account ID next you have to:
- Connect to your pre-existing data sources
- In case you want to create new data sources select “Create New Data Source” option which you can find in the bottom right corner.
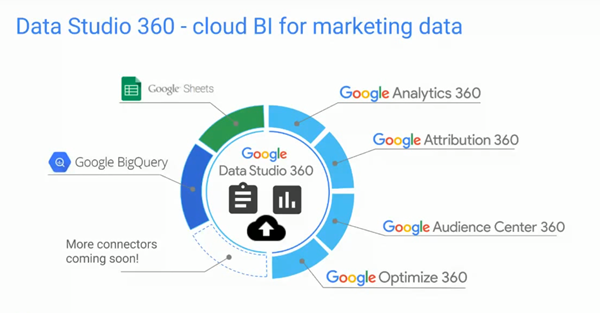
- It is the sheer number of available sources that make Google Data Studio so much advanced and helpful. Some of the main data sources for user are:
- Google Analytics
- Google AdWords
- Google Sheets
- Google BigQuery
- Data Set-up
- Pull up the data from the Data source to carry on with customizable live reports which is presented in:
- Time-periods
- Segments
- Geographies
- Filters
The above mentioned are some of them and you can find many much helpful tools and features.
There are plenty of options for a user to present the data in any appealing form. You can easily view the data from Google AdWords. For that, just choose the graph you want to show and then change the Data Source.
The effectiveness of Google Data Studio is quite visible here.
- You can easily compare data of various sources and point out the difference without any trouble.
- Design and finalize the report.
- In case you want to make changes or any modification you can do so by clicking on toggle for “Edit”.
You can easily share your report with other professionals. Just add the e-mail address of the people you want the report to be shared and click on “Share”.
The Editor Access option gives option to the editor to:
- Review, Edit or add comments
- Dashboard and report management
Why Should You Use It?
It offers more than just a simple report. You can get creative and make use of various customization features to make your final report look appealing and pleasing to the viewers.
With Real time collaboration teams can access and make subsequent changes to the report as needed.
There is no complex or lengthy process. Generally, it does not take much to get accustomed to all the necessary features and it is safe to say that you can easily make it work to your advantage.
A Highly Effective Tool for Data Reporting and Visualization
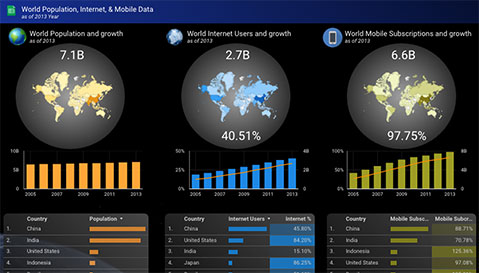
Visualization tools: Data Studio gives you many exciting options to represent the data with the help of. No longer does the data have to appear mundane and boring. With proper representation you can bring it to life. It is easy to refer to the figures and statistics. Also, you can easily refer to the difference in the report of various sources with ease.
Easy to share: Users can easily share the report with concerned parties with ease. Data Studio makes it possible for teams to work on a single platform and make relevant changes in real time.
Interactive: All the data that you put in your report is quite easy for anyone to refer to understand. With the use of table, pie charts or graphs one can easily represent the data without any miscalculation or misappropriations.
Efficient: It does not matter if you do not actually belong to technical field. It is quite easy to work with and the end result is just there for you to see. All the available sources that are already there for you to refer to and make use of reduces time spend to acquire data. You can focus on preparing a perfect report rather than being worried about the data and statistics.
What More Can Be Done?
While it is a near perfect entity there is bit that can surely be worked upon.
For starters it would be a great addition to let the users add and view data from other non-Google properties or other social platforms. Google makes it possible to work efficiently with Google owned properties but certainly it would be nice addition to let users access other sources as well.
While you can find every necessary feature that you may require preparing a report it would be great if a user could just refer to previous dashboards or format to access to.
All in all Google Data Studio is a dream for every professional. It simply integrates every facet of professionalism with creativity. No longer do the professionals have to go the lengths of customizing their reports for hours and in some cases for days. Once you get hang of it you can make reports with ease. You will only get better after initial try outs. So, go on and try Google Data Studio without any delay or inhibition.
Also See: